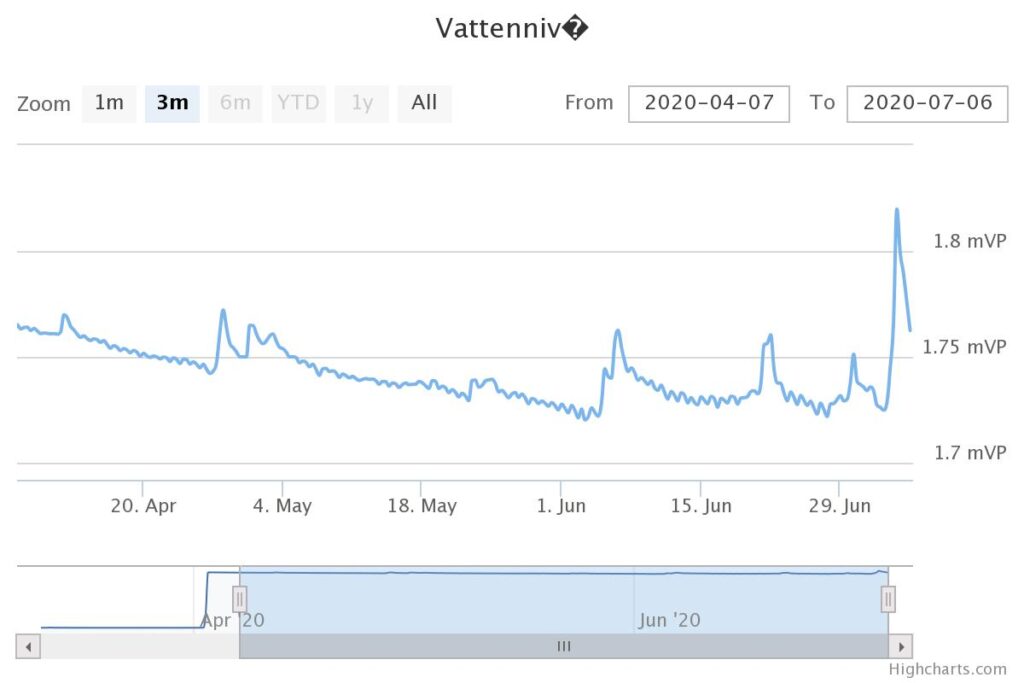
An example of the data gathered. The picture shows untreated data, illustrated as a graph directly generated by the program. It is good for a quick check on the water level meters from the office, without have to go out in the field, and means that we have good control of the water level situation in all the CWs at all times. All data points are downloaded separately.