Methods
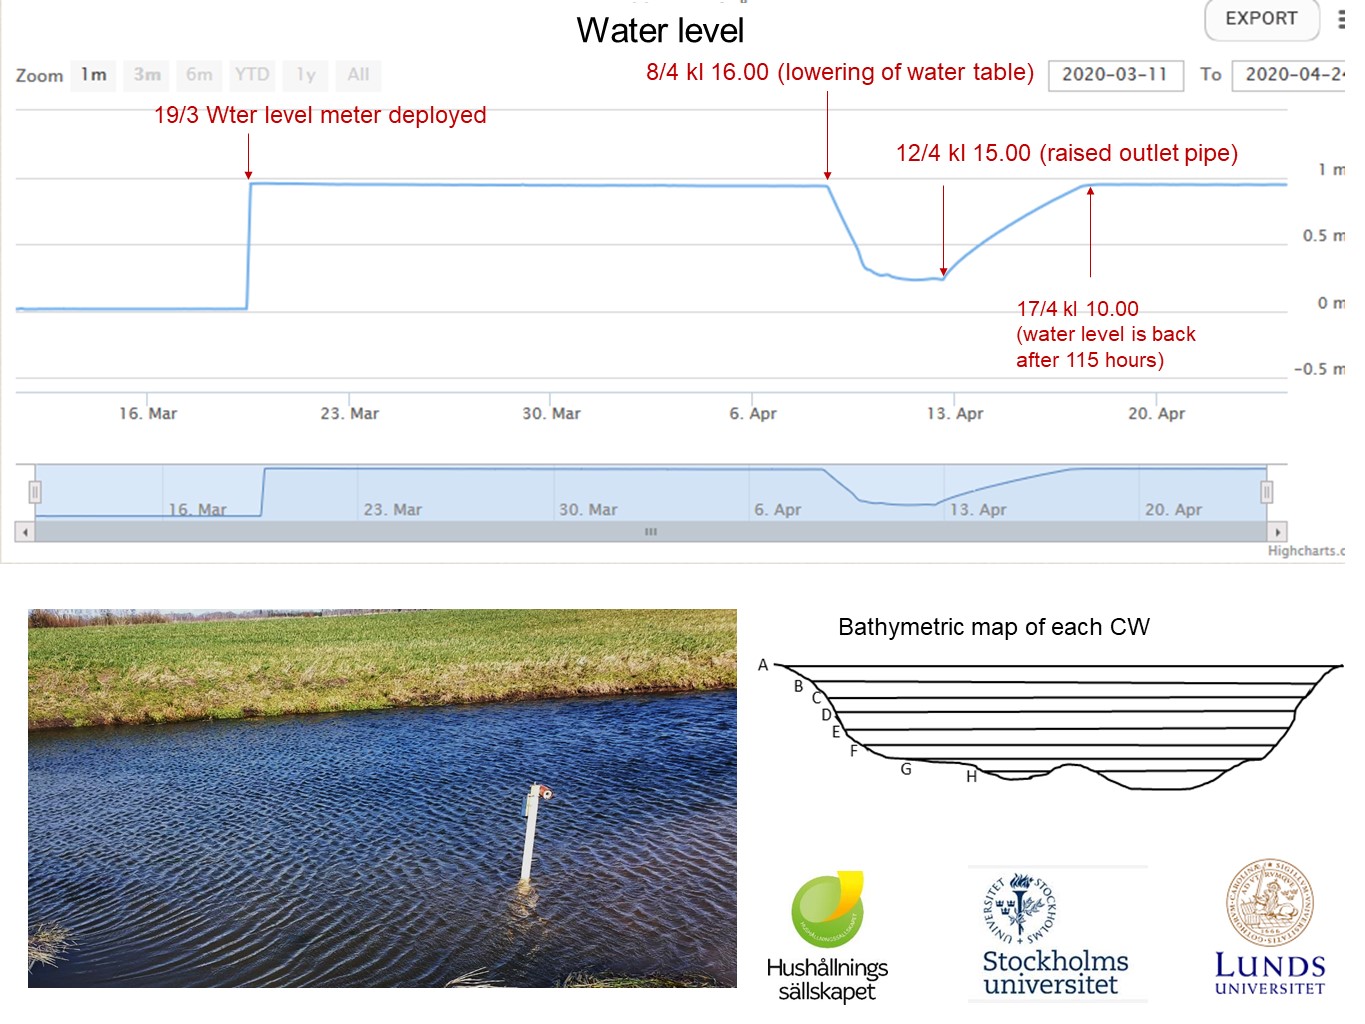
We will compare buffering capacity of CWs depending on topographical features (slope, depth, surface area, soil type), inlet/outlet solution and vegetation cover, both temporally (delay, days) and spatially (volume, m3). We do this by using in situ water level meters with a high temporal resolution (1 hour) combined with bathymetric data of the CWs. Since we have the possibility to manipulate the water level in the majority of the CWs we can also experimentally test e.g. buffering capacity at different flow regimes. Figure 2 shows a situation were a CW had a buffering effect for at least 115 hours that specific time.
We will study biodiversity responses of littoral arthropods in CWs as a function of the flooding regime at the aquatic-terrestrial boundary, and the importance of CW storage capacity during drought for pollinating bees. This will be done by several different sampling methods, including Malaise-traps, suction sampling, pit fall traps, color bowls and netting. Also for this studies it is advantageous that we can empty the wetlands and thus simulate draught situations.
To evaluate current modelling approaches and to suggest improvements, we will compare our quantitative data with model outcomes for the same wetlands. In distributed hydrological modelling, based on elevation data and field-checked stream networks, we will investigate whether observations can be reproduced at different spatial resolution and process complexity (e.g. regarding surface water-groundwater interactions). These results will give useful insights on how complex models needs to be in order to reproduce the buffer capacities in whole catchments. The developed model will also be used to investigate possible impacts of future climate change on landscape-scale buffering capacities.
Figure 2.